Is the welfare state economically sustainable?
The demographic arithmetic says the bill is coming due. The Nordic countries say it’s already being paid. Both are right, which means the real question is which one you let win.
The entitlement crisis: heading for a fiscal wall?
“If current laws generally remained unchanged, federal debt held by the public would reach 166 percent of GDP in 2054 and would be on track to climb even higher, driven by growth in spending on Social Security, Medicare, and net interest.”
— after Congressional Budget Office, The Long-Term Budget Outlook, 2024
The “entitlement crisis” is one of the longest-running fixtures of rich-democracy politics: a debt clock, a trust-fund countdown, a demographic time bomb. We take the welfare state’s existence as given and ask one thing, can it be paid for? For the prior question of what kind of thing it is — insurance, redistribution, or stabilization — see the companion walkthrough, Is the welfare state insurance, redistribution, or stabilization?
Before deciding whether the projection is frightening, you need to know what “unsustainable” asserts. A spending path is fiscally unsustainable if it implies an ever-rising debt-to-GDP ratio, one the government’s intertemporal budget constraint cannot accommodate at the prevailing gap between the interest rate it pays and the rate its economy grows. The deep apparatus, the government budget constraint and the debt-dynamics condition, arrives in Stage 2; for now, “the debt explodes” is a statement about a differential equation.
One distinction defuses half the panic. When the Social Security or Medicare Trustees announce that a trust fund “runs out” in some year, that is not bankruptcy. A pay-as-you-go program collects payroll taxes today and pays benefits today; the trust fund is an accounting buffer. Exhaustion triggers a decision — cut benefits, raise the tax, or top up from general revenue.
For the formal home of the constraint that all of this operates inside — the government budget constraint, debt dynamics, and the conditions under which a debt path stabilizes — the apparatus lives in Ch 16 §16.3 (The Government Budget Constraint).
What the entitlement-crisis frame is claiming
Strip the rhetoric and the unsustainability frame makes four moves. One: the population is aging, fewer workers per retiree, every year. Two: the programs built when workers were plentiful made promises that get more expensive per worker as the worker pool shrinks relative to the retired pool. Three: the trust funds that buffer the gap are drawing down, and the Trustees publish the year each runs dry. Four: closing the resulting gap means either taxes rising toward a ceiling voters won’t tolerate, or debt climbing on the trajectory the CBO charts. Put together, the claim is that the welfare state is on a collision course with arithmetic.
Waving this away as scaremongering would be a mistake. The frame has a real arithmetic core, and Stage 2 inhabits it at full strength, the dependency ratio really is doubling, and on autopilot the debt path really does climb. But it also has a serious counter, which Stage 3 makes. The countries that run the largest welfare states on earth fund them at more than half of GDP and remain prosperous, competitive, and solvent. The question has not yet been asked precisely.
Where this leaves us
The entitlement-crisis frame points at something real, but notice what the scary debt number depends on. The CBO projection is a current-policy projection, one that assumes the rules never change, retirement ages stay fixed while people live longer, tax levels never rise, productivity does nothing extra. That assumption is doing enormous work. So what you carry out of Stage 1 is a sharper question: unsustainable on autopilot, or unsustainable full stop?
The countries that run the biggest welfare states on earth have spent decades changing the rules that projection holds fixed. But before we ask whether the welfare state is affordable, we owe the other side its strongest case. Stage 2 makes the argument that it isn’t.
The demographic arithmetic, at full strength
“The old-age dependency ratio in OECD countries is projected to nearly double between 2020 and 2060, from around 30 to over 50 people aged 65 and above for every 100 people of working age.”
— after OECD, Pensions at a Glance, 2023
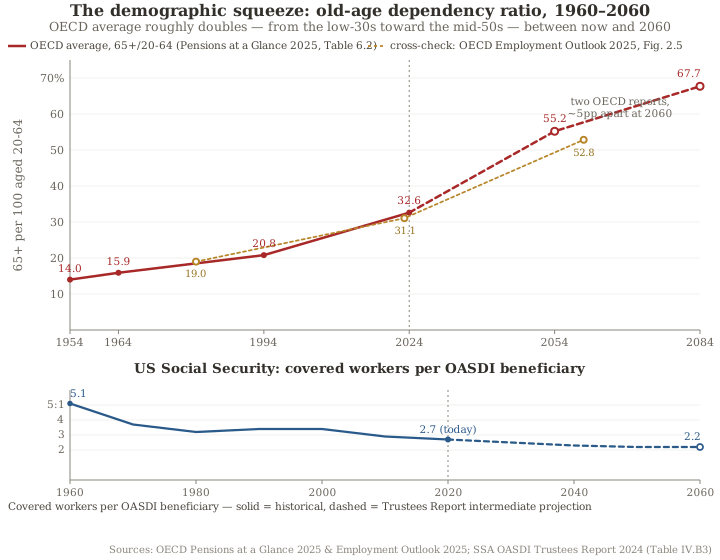
This is the arithmetic core of the unsustainability case. In the United States the ratio of workers to retirees has fallen from roughly 5-to-1 in 1960 toward 2.5-to-1 today, and the future retirees are already born.
Why does an aging population pressure a welfare state at all? The answer is in the way pay-as-you-go (PAYG) pensions work. A PAYG pension is not a savings account; it is an intergenerational transfer, today’s workers pay today’s retirees, on the promise that tomorrow’s workers will pay them. Paul Samuelson formalized this in 1958 as the “consumption-loan” model, where the scheme delivers an implicit return equal to the growth rate of the wage bill, population growth plus productivity growth. When the working generation is large and growing, the math is generous. When the worker-to-retiree ratio falls, the implicit return falls with it, and a promise calibrated to 5-to-1 becomes mechanically under-funded at 2.5-to-1.
That under-funding shows up in the budget. Whether the gap is closed by higher taxes, lower benefits, or borrowing, the debt path is governed by a single condition: debt-to-GDP rises whenever the primary deficit exceeds the balance that the interest-growth differential ($r - g$) can stabilize. When projected pension and health spending pushes the primary balance below that stabilizing line year after year, the present-value shortfall, the fiscal gap, is what the CBO projection in Stage 1 was measuring.
In the consumption-loan model, the steady-state return to a PAYG system is the growth rate of the contribution base:
$$r_{\text{PAYG}} = n + g$$where $n$ is population growth and $g$ is productivity growth. A falling $n$ (the demographic transition) directly lowers the system’s implicit return. Debt-to-GDP, meanwhile, evolves as:
$$\Delta b = (r - g)\,b - s$$where $b$ is debt-to-GDP, $s$ is the primary surplus, and $r-g$ is the interest-growth differential. The path stabilizes only when the primary surplus covers $(r-g)\,b$. An aging-driven rise in spending pushes $s$ negative; if $r > g$, debt compounds.
A PAYG pension is a chain letter that works as long as each generation is bigger and richer than the last. The pension you receive is paid by the workers behind you. When the generation behind you shrinks, the chain strains, because there are fewer shoulders to carry the same promise. The bill arrives when the big generation retires and the small one shows up to pay for it.
Two chapters carry the theory behind this. The overlapping-generations machinery that makes the “return equals growth” result precise lives in growth theory; the micro-founded life-cycle account of how people save and dissave across a lifetime sits in intermediate macro.
The deep debt-sustainability apparatus — the full $r-g$ treatment, the fiscal theory of the price level, the conditions under which debt is or isn’t a free lunch — is the spine of a companion walkthrough: Does government spending help the economy? carries the debt-dynamics depth.
The unsustainability case, made by its strongest advocates
“Democracies will run persistent deficits because the political process systematically biases toward present benefits financed by future taxes, the costs are borne by taxpayers who do not yet vote.”
— after James Buchanan & Richard Wagner, Democracy in Deficit, 1977
Take the case at its strongest, as an OECD pension actuary and a public-choice economist would jointly put it. The people who will be 65 in 2055 are already alive, already counted, so the demographic transition carries no error bars. PAYG promises written when the worker-to-retiree ratio was 5-to-1 are arithmetically under-funded at 2.5-to-1, and no amount of optimism changes the ratio. On current-policy autopilot, the projected spending paths are not financeable at any plausible interest-growth differential, the fiscal gap is real and large. The public-choice tradition supplies what the technocratic version misses. The parametric fixes that would close the gap are chronically deferred, because democracies reward the politician who protects benefits today and punish the one who trims them. The deficit bias is structural. So the political system is built to keep the gap open. This case is the arithmetic, plus a theory of why the arithmetic keeps winning.
“Every one of those projections assumes the rules never change. No welfare state has ever held them fixed for fifty years.”
— the affordability rebuttal, previewed (Stage 3 makes it in full)
The rebuttal, in preview, grants the arithmetic and attacks the autopilot. The scary number is a projection of no adjustment: fixed retirement ages, fixed tax levels, no extra productivity, no immigration. Strip that assumption out and the gap is a to-do list. Whether the to-do list gets done is a real question. Whether it can be done is the question Stage 3 settles.
Where this leaves us
The demographic arithmetic is real and the autopilot projection is unsustainable, if nothing changes. The projection holds retirement ages, tax levels, and productivity fixed, and no actual welfare state has held them fixed. So the unsustainability case is correct as a conditional (unsustainable on autopilot) and overclaims the moment it asserts an unconditional (unsustainable full stop). The historical record matters here. The pay-as-you-go promises now under pressure were built during the postwar boom of 1945–1973, the demographic dividend that financed the buildout is the mirror image of the demographic drag now, a story told in History Ch.14 (Postwar golden age and decolonization), with the aging of the OECD core tracked in Ch.18 (Globalization and the great moderation). The intellectual lineages converge here too. The postwar settlement that made the promises carries a Keynesian / Beveridge inheritance traced in History of Economic Thought Ch.8 (The Keynesian revolution), while the deficit-bias diagnosis is the home turf of Ch.14 §14.4 (Public choice: government failure).
So the arithmetic is real. The dependency ratio really is doubling; the autopilot debt path really does climb. That is why the affordability case cannot wave it away, and why it doesn’t try to. Stage 3 changes the rules the arithmetic assumes, disaggregates the spending path, and asks where the binding constraint lives.
The affordability counter: the ceiling is a choice
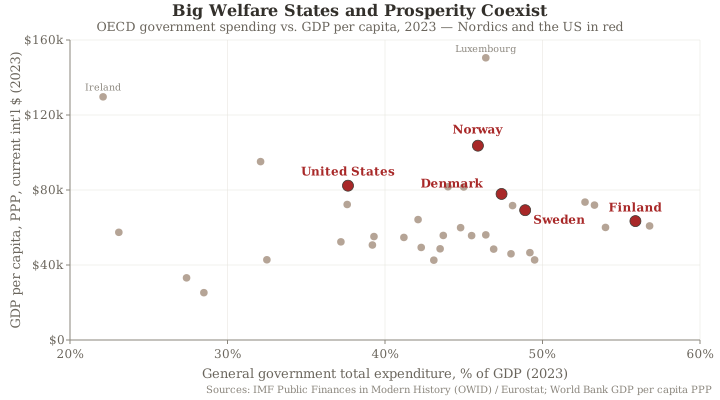
“Denmark, Sweden, and Norway tax and spend at close to half of GDP, run welfare states more generous than almost anywhere on earth, and sit near the top of every ranking of prosperity and competitiveness. If that is ‘unsustainable,’ the word has lost its meaning.”
— the affordability case, after Lane Kenworthy and the comparative-welfare-states literature
The Nordic evidence is the hardest fact for the unsustainability case to absorb. Denmark, Sweden, and Norway are among the richest, most productive societies in history, running the very welfare states the “entitlement crisis” frame says cannot be paid for.
The same government budget constraint Stage 2 read as a fiscal cliff is read now with one term flipped from fixed to chosen. In Stage 2 the tax level was held constant and the question was: can we finance the promises? Read the identical equation with the tax level as a choice variable and the question becomes: at what tax level do the promises finance themselves? The Nordic answer is roughly 50–55% of GDP, well above current US or Anglo levels, and demonstrably non-catastrophic. You can see the prosperity side of this on the GDP-per-capita map, Norway and the rest of the high-welfare rich world sit at the top of the long-run trajectories; the welfare-share half of the correlation comes from the cross-country evidence below. The binding constraint, on this reading, is the tax level a society chooses.
The tax level is only the first of four levers, and it is rarely even the most important. Retirement-age indexation, tying the pension age to rising longevity, closes a large share of the pension gap on its own, because it directly raises the worker-to-retiree ratio the arithmetic depends on. Productivity growth relaxes the $r-g$ condition from the other side, since a faster-growing economy can carry a larger spending path at the same debt ratio. Female labor-force participation and immigration both enlarge the contribution base directly, slowing or reversing the dependency-ratio drag. The fiscal gap is a quantity that shrinks as you pull any of these levers.
The same debt-dynamics condition from Stage 2, now solved for the policy levers that close the gap. The required primary surplus to stabilize debt is $s^{*} = (r-g)\,b$. The gap $G$ between projected and required surplus is closed by any combination of:
$$G = \Delta\tau \cdot Y + \Delta(\text{ret. age}) \cdot \rho - \Delta E + \Delta g \cdot \phi$$where $\Delta\tau$ is a higher tax share, $\Delta(\text{ret. age})$ raises the contribution base by $\rho$ per year of indexation, $\Delta E$ is reduced excess cost growth, and $\Delta g$ is faster productivity growth scaled by $\phi$. The coefficients are illustrative; the gap is a function of policy choices.
The fiscal gap closes if you pull any of four levers: tax a little more, retire a little later, grow a little faster, or bring in more workers. It can always close; the open question is which lever, and whether the politics will allow it. Those are different questions, and confusing them is how a solvable problem gets called a crisis.
Disaggregate the spending path. Bundle pensions and healthcare together and the welfare state looks like one swelling mass. Separate them and the picture changes. Pensions are demographically pressured but parametrically fixable, indexation handles them. Healthcare is different. Its pressure is excess per-capita cost growth, costs rising faster than GDP year after year, for reasons that live in the structure of the healthcare market, adverse selection, the labor-intensity of care (Baumol’s cost disease), administrative complexity. That is a market-structure problem, traced in Ch 4 §4.6 (Information Asymmetry).
Why healthcare costs grow faster than GDP, the full market-structure account, is its own large question, engaged at depth in Is healthcare a market like any other?.
The affordability case, made by its strongest advocates
“It is well known that no Darwinian mechanism guarantees that high social spending must be paid for with slower growth. The cross-country record shows large welfare states and prosperity coexisting, a free lunch the conventional view said could not exist.”
— after Peter Lindert, Growing Public, 2004
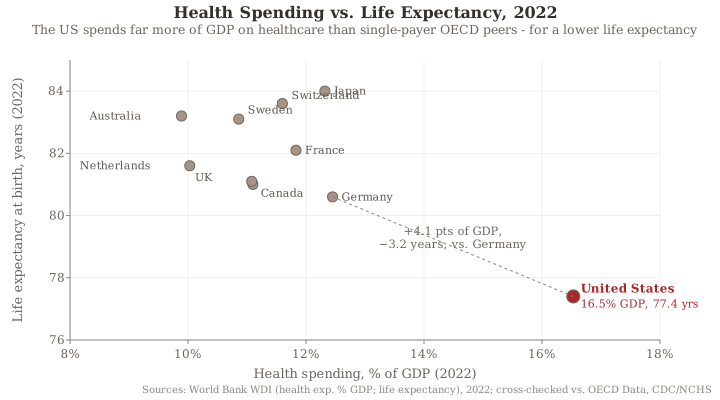
Take the affordability case at full strength, as Lindert and the comparative-welfare-states scholars would put it. The Nordic states run welfare states at 50%+ of GDP and are prosperous, competitive, and not in fiscal crisis, decade after decade. Lindert’s “free lunch puzzle” explains why this isn’t a fluke. Large welfare states are financed in growth-friendly ways and they buy productivity-supporting goods — health, education, childcare that frees parents to work — so the predicted growth penalty never materializes in the data. Now bring the demographic arithmetic from Stage 2 back. It is real, and it is addressable. Retirement-age indexation alone closes much of the pension gap, and the Nordics, Germany, and others have been indexing for decades; this is what these states already do. When you disaggregate, the binding pressure is healthcare cost growth, a healthcare-system problem. Pensions are parametrically fixable, and the Nordics disprove any general ceiling on welfare-state size. The United States spends roughly 17% of GDP on healthcare for worse population outcomes than OECD single-payer systems achieve at 10–11%. The “entitlement crisis” headline bundles a genuine healthcare-system inefficiency with the size of the welfare state and mis-locates the problem. Fix the headline and you find the affordability case standing on cross-country evidence.
“‘It’s a political choice’ is true and almost useless. A choice that is economically trivial can be politically impossible, ask anyone who tried to raise a retirement age.”
— the honest pushback the verdict has to weigh
The rebuttal grants the economics and presses on three soft spots. First, “political choice” can quietly become “therefore easy”, but a parametric adjustment that is trivial on a spreadsheet can be near-impossible at the ballot box. Second, nobody has shown 50–55% to be an upper bound; it is simply the highest level anyone has run, and whether the tax level can rise further without real distortion is contested. Third, healthcare cost growth is named as the hard part, and naming it does not solve it, if it compounds unaddressed, it can swallow the savings the other levers produce. None of this overturns the affordability case, but Stage 4 has to honor all of it.
“It’s not the welfare state that’s unsustainable. It’s American healthcare costs, and that’s a different problem with a different fix.”
— the disaggregation claim, the move most likely to be missed
Is healthcare the real entitlement crisis?
The phrase “entitlement crisis” lumps pensions and healthcare into one swelling problem. Pull them apart and they behave nothing alike. One is a demographic squeeze you can index away. The other is a cost-growth engine that lives in the structure of a market.
Where this leaves us
The affordability case is correct as economics. There is no demonstrated economic ceiling at the welfare-state sizes observed; the Nordic evidence settles that 50%+ of GDP is sustainable; the demographic arithmetic is addressable through parametric adjustment; and the binding pressure disaggregates to healthcare cost growth (a system problem) plus political will (the adjustments are easy as economics, hard as politics). “Unsustainable” is therefore mostly wrong as a pure-economic claim. This contests a specific historical narrative, the post-1980 “the welfare state is too expensive” turn told in History Ch.16 (Stagflation and the neoliberal turn), while the Nordic-model buildout that is the affordability case’s empirical workhorse traces back to the social-democratic settlement in Ch.14 (Postwar golden age). The cross-country welfare-and-growth evidence at the heart of this stage, Lindert’s Growing Public and the comparative-welfare-states literature, sits outside the history of economic thought proper; the public-choice tradition that voiced the “too expensive” attack is History of Economic Thought Ch.14 §14.4 (Public choice).
Two of the four levers open onto questions large enough to have their own walkthroughs. The tax-level lever — how high can a society tax, and through which instruments — is engaged at depth in Is inequality a problem economics can solve? (the redistribution-and-top-rates question) and in Wealth tax or income tax? (the wealth-as-revenue-source question). The prior question of how a state acquires the fiscal capacity to tax at 40–50% of GDP at all is traced across eras in How did states learn to tax? (state formation across eras). And the framing that affordability is a political choice is one strand of Is there a coherent left economics?
Two cases, both strong. The demographic arithmetic is real (Stage 2). The Nordic evidence and the offsets are real (Stage 3). So is the welfare state sustainable? The answer is “yes, as a choice; no, as autopilot”, and an honest verdict has to say which constraint binds. Stage 4 adjudicates.
The verdict: sustainable as a choice, unsustainable on autopilot
You arrive at Stage 4 holding two strong cases, and the easy move now is to split the difference: “both sides have a point.” That loses everything the walk earned. Respecting both Stage 2 and Stage 3 means saying exactly what is sustainable, under what conditions, and where the real constraint lives.
Two conceptual tools are enough to take Stages 2 and 3 into a verdict, with no new apparatus. The first is the autopilot-versus-adjustment distinction. A projection that holds the rules fixed answers a different question from one that lets them change, and almost all of the scary numbers are autopilot numbers. The second is disaggregation. Demographic pressure behaves nothing like cost-growth pressure, and pensions behave nothing like healthcare.
The adjudication, in three moves
- What’s sustainable, and what the offsets do. Rich societies can afford generous welfare states, the Nordics demonstrate it at 50%+ of GDP. The demographic gap is closable by parametric adjustment, with the offsets carrying different shares: retirement-age indexation to longevity is the largest pension-gap closer; productivity growth, female labor-force participation, immigration, and a higher tax level each carry part of the rest. Exactly which margin closes how much is where the mainstream’s internal variation lives.
- The real constraint is healthcare. Disaggregate and the binding pressure changes address. Pensions are demographically pressured but parametrically fixable. The compounding pressure is healthcare cost growth, a healthcare-system efficiency problem — excess per-capita cost growth, Baumol’s cost disease, the US-versus-OECD cost gap — far more than a welfare-state-size problem. The “entitlement crisis” headline mis-locates the problem by bundling healthcare cost growth with the welfare state’s size; the mechanism of why those costs grow is the work of Is healthcare a market like any other?
- The other real constraint is political will. The adjustments that close the gap are economically modest and politically near-impossible: the French 2023 retirement-age-to-64 protests, the perennial US “third rail” of Social Security reform, the post-2008 European austerity overshoot. “It’s a political choice” cuts both ways, affordable as economics, but not therefore easy. Whether the post-1980 “unsustainable” attack was even a coherent policy turn is itself contested in Did neoliberalism actually rule?
The verdict
Is the welfare state economically sustainable? The answer is sustainable as arithmetic and political choice, not as autopilot. Rich societies can fund generous welfare states; “unsustainable” is mostly wrong as a pure-economic claim. But sustainability requires active parametric adjustment that is politically hard, and the binding pressure is healthcare cost growth plus political will.
Everyone agrees rich societies can afford welfare states, and everyone uses the same fiscal-gap, cost-growth and offsets arithmetic. The disagreement is about magnitudes: which offset closes how much, how binding healthcare is over what horizon, how achievable the adjustments are.
Where this leaves us
We started with the CBO’s debt clock and the perennial claim that the welfare state is heading for a fiscal wall. Stage 2 conceded what the claim gets right: the demographic arithmetic is real, the dependency ratio really is doubling, and on autopilot the debt path really does climb. Stage 3 then changed the rules the arithmetic assumed. The Nordic states fund welfare at half of GDP and stay prosperous, the demographic gap closes if you pull any of four levers, and once you disaggregate the spending path the binding pressure is healthcare cost growth. Stage 4 refused both punts, the doomer’s “it’s doomed” and the optimist’s “it’s easy”.
So the welfare state is on a collision course with the politics of changing rules that voters would rather leave fixed, and with a healthcare market that grows more expensive for reasons of its own. The next time someone tells you the welfare state “can’t be paid for,” you have the tools to ask the three questions that take the claim apart: autopilot or adjusted, pensions or healthcare, economic or political.